 Fundamentals Hub
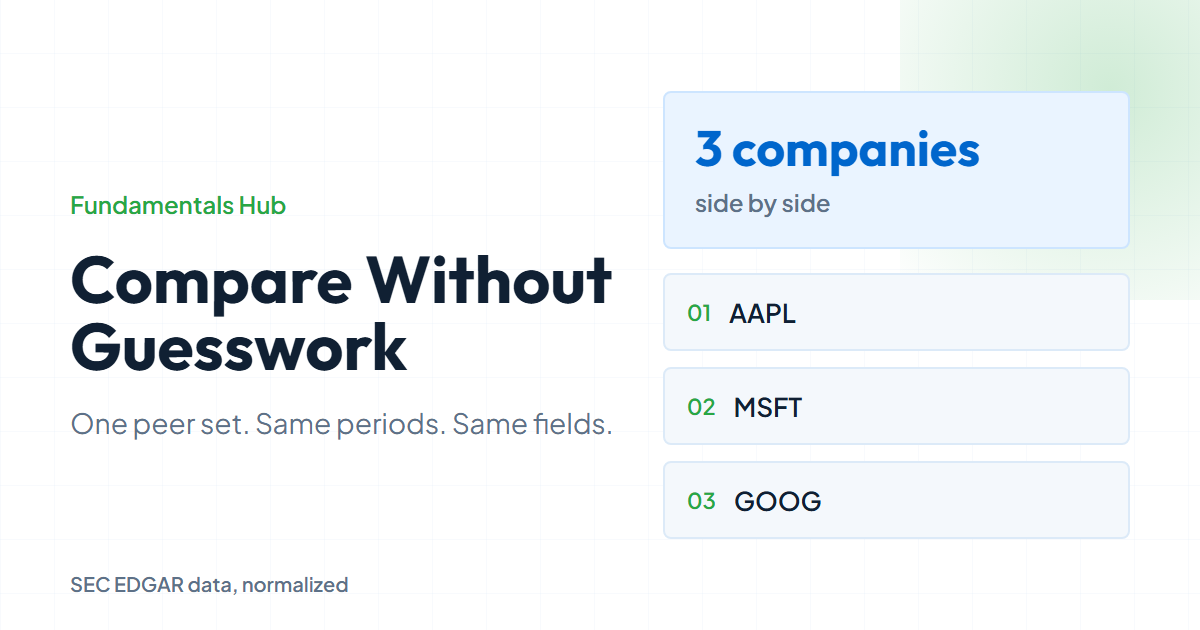
The first comparison table looks clean: Apple, Microsoft, and Alphabet in three neat columns. Revenue, operating income, net income, cash, debt, free cash flow. Then the questions start. Is one company better because revenue is higher, or only larger? Are the periods aligned? Is the cash flow figure annual, quarterly, or trailing twelve months? Did each provider use the same field definitions?
This guide shows how to compare company financials without turning the exercise into a spreadsheet of misleading numbers. It is about the side-by-side workflow: peer selection, period alignment, common statement fields, and the handful of ratios that make the table useful. It will not repeat the basics of what each statement means. If that is the starting point, read how to read financial statements first.
How to Compare Company Financials Without Mixing Periods
- company financials
- Company financials are income statement, balance sheet, and cash flow data used to evaluate a business.
- peer set
- A peer set is a group of companies similar enough that their margins, leverage, and cash flow can be compared meaningfully.
- TTM
- TTM means trailing twelve months: four consecutive standalone quarters for flow data and the latest quarter for balance-sheet data.
- free cash flow
- Free cash flow is operating cash flow minus capital expenditures.
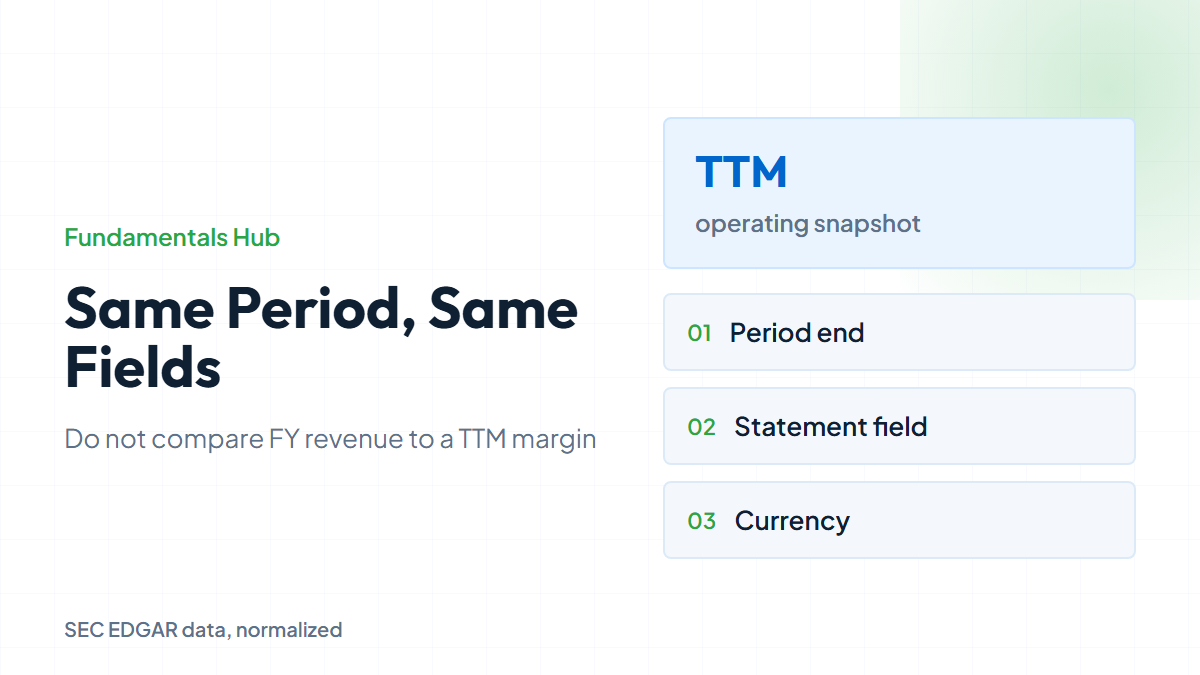
The most common comparison mistake is not a formula error. It is mixing measurement bases. One company might show fiscal year results, another might show trailing twelve months, and a third might have a quarter that ended a month later. A spreadsheet can still calculate ratios, but the output answers the wrong question.
Start each comparison by writing the basis at the top of the page:
- Peer set: the companies included and why.
- Period type: annual, quarterly, or TTM.
- Period end: the latest date used for each company.
- Currency and unit scale: raw dollars, thousands, millions, or billions.
- Field source: normalized API fields, SEC filings, or a specific provider export.
TTM is useful when you want a current operating snapshot. Annual data is better for long-term trend work because it avoids some quarter-to-quarter noise. Quarterly data is best when the question is about recent change, seasonality, or a filing that just landed.
Do not compare a fiscal year margin to a TTM margin unless the point is to measure the difference between those bases. The basis is not a footnote. It is part of the answer.
Choose the Peer Set Before the Table
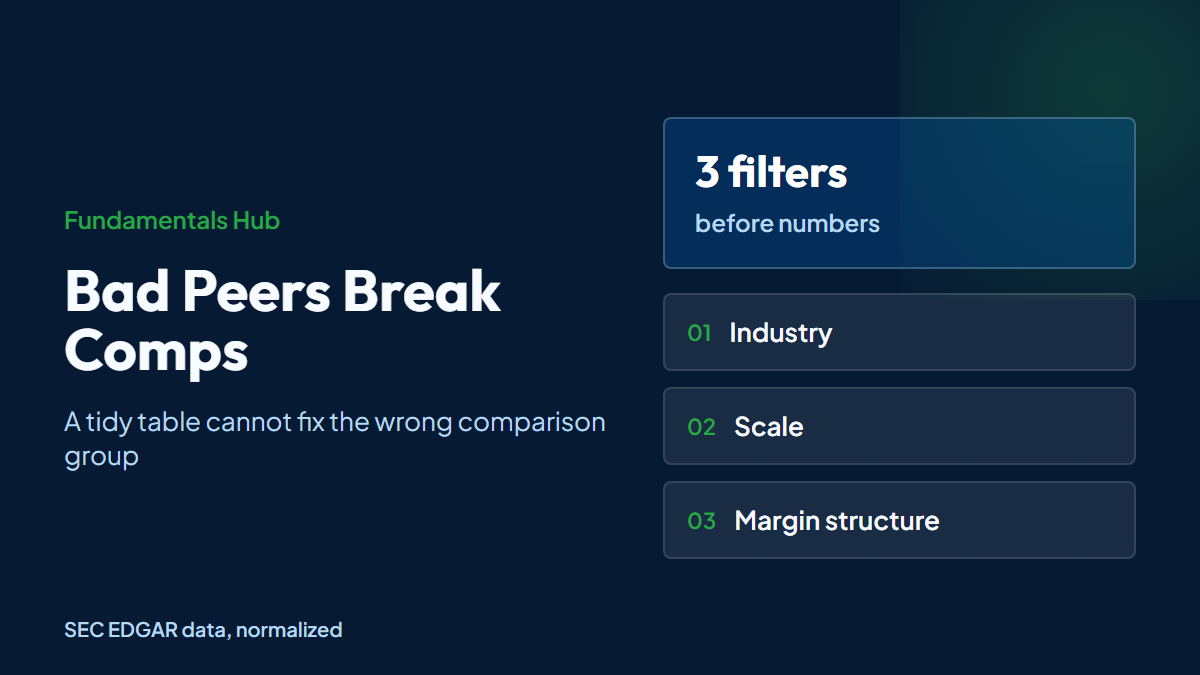
A peer set is not a list of tickers people recognize. It is a group of companies close enough that their economics can be compared. Two software companies can have different margins because one sells subscriptions and another sells implementation-heavy services. Two retailers can have different asset turns because one owns stores and another leases distribution-heavy operations.
Build the peer set with business questions first:
- What product or service does each company sell?
- Who pays the company, and how recurring is the revenue?
- Does the business need heavy inventory, factories, leases, or working capital?
- Are the companies at similar maturity, or is one still in a high-growth phase?
- Does one company include a segment that changes the economics?
Only after that screen should you rank metrics. A poor peer set can make a company look cheap, inefficient, or overleveraged for reasons that have nothing to do with execution.
Put Companies on the Same Period Basis
Financial statements have two kinds of measures. Flow measures cover a period. Revenue, operating income, net income, cash from operations, capex, and free cash flow are flows. Balance sheet measures are point-in-time values. Cash, total assets, total liabilities, debt, and equity are as-of numbers.
That difference matters when comparing company financials. TTM revenue is a sum of four consecutive standalone quarters. Total debt is the latest balance sheet value. If you build ratios, the numerator and denominator need sensible timing. For example, free cash flow margin uses a flow divided by a flow. Debt to assets uses an as-of liability measure divided by an as-of asset measure.
Use a table like this before analysis:
| Field | Statement | Timing | Comparison use |
|---|---|---|---|
| Revenue | Income statement | Flow | Scale and growth |
| Operating income | Income statement | Flow | Core profitability |
| Net income | Income statement | Flow | Earnings after taxes and non-operating items |
| Free cash flow | Cash flow | Flow | Cash generation after capex |
| Total debt | Balance sheet | As-of | Leverage and risk |
| Total assets | Balance sheet | As-of | Capital base and balance sheet scale |
A practitioner detail: Q2 and Q3 flow facts may be standalone-quarter or cumulative year-to-date values, so classify each field by its dates before subtracting anything. There is no Q4 10-Q; derive each additive Q4 flow as FY 10-K minus Q1, Q2, and Q3. TTM flows then sum four consecutive standalone quarters, while TTM balance-sheet fields use the latest quarter. If you use normalized data, still label period type clearly so a reader knows whether the column is FY, Q, or TTM.
Compare the Income Statement First
The income statement gives the first pass on scale and profitability. Start with revenue, then move down the statement to see how much of that revenue survives each stage.
Useful side-by-side fields:
- Revenue
- Gross profit
- Operating income
- Pretax income
- Income tax
- Net income
- Diluted EPS
Revenue answers scale. Gross margin gives pricing power and cost structure. Operating margin gets closer to the economics of the core business. Net margin includes taxes, interest, and non-operating items, so it can move for reasons that are not purely operating.
Use formulas that are visible in the model:
gross_margin = gross_profit / revenue
operating_margin = operating_income / revenue
net_margin = net_income / revenue
Do not stop at the highest margin. Ask why the margin exists. A company with high operating margin might have a durable software model. It might also be underinvesting, benefiting from a one-time cost cut, or mixing a high-margin segment with a low-growth core.
Then Check the Balance Sheet
The balance sheet explains how the company funds the business. Two companies can have similar margins and very different risk if one carries far more debt, lease obligations, or working capital pressure.
Start with these fields:
- Cash and equivalents
- Current assets
- Total assets
- Current liabilities
- Total liabilities
- Short-term debt
- Long-term debt
- Total equity
The first comparison is liquidity: can the company cover near-term obligations? The second is leverage: how much debt supports the operating model? The third is capital intensity: how much asset base is required to produce the revenue and profit shown on the income statement?
Common ratios:
current_ratio = current_assets / current_liabilities
debt_to_assets = total_debt / total_assets
debt_to_equity = total_debt / total_equity
asset_turnover_approx = revenue / period_end_total_assets
For a quick first pass, period-end assets are acceptable if that is the only balance sheet value you have in the comparison table. For more formal analysis, use average assets across the period. Ratios are not rules. A utility, bank, retailer, and software company can have very different balance sheet structures. Use the ratios to find questions, then answer them with business context.
Follow Cash Flow Before Ranking Winners
Cash flow separates accounting profit from actual cash generation. A company can report strong net income while cash from operations lags because receivables are rising, inventory is building, or working capital is moving against it. The opposite can also happen when non-cash expenses depress earnings but cash stays healthy.
For side-by-side work, use:
- CFO, or cash from operations
- Capex
- Free cash flow
- Free cash flow margin
- Free cash flow conversion
free_cash_flow = cfo - abs(capex)
fcf_margin = free_cash_flow / revenue
fcf_conversion = free_cash_flow / net_income
Using abs(capex) makes the formula work whether the source stores capital expenditures as a positive cash spend or a negative cash flow. If your source already exposes free cash flow, verify its sign convention before comparing it with a value you calculate yourself.
Free cash flow is covered in more depth in the free cash flow explainer. For comparison work, the core habit is simple: if operating income and free cash flow tell different stories, do not rank the company until you understand why.
(Fundamentals Hub normalizes income statement, balance sheet, and cash flow fields before you compare them, so the side-by-side table uses the same field names across companies.)
Build a Reusable Comparison Table
The best comparison table is narrow enough to scan and explicit enough to audit. A starting table might include:
| Category | Metric | Why it belongs |
|---|---|---|
| Scale | Revenue | Shows business size |
| Profitability | Operating margin | Compares operating economics |
| Cash | Free cash flow margin | Tests cash generation |
| Leverage | Debt to assets | Flags balance sheet risk |
| Efficiency | Asset turnover | Shows revenue per dollar of assets |
Here is a compact Python example using the public API pattern from the financial data Python guide. It calls the authenticated /api/v2/companies/{ticker}/financials endpoint for each ticker and builds one comparison row per company:
import os
import requests
import pandas as pd

BASE_URL = "https://fundamentalshub.com/api/v2"
API_KEY = os.environ["FUNDAMENTALS_HUB_API_KEY"]

session = requests.Session()
session.headers.update({"X-API-Key": API_KEY})

def ratio(numerator, denominator):
    if numerator is None or denominator in (None, 0):
        return None
    return numerator / denominator

def get_latest_fy(ticker):
    response = session.get(
        f"{BASE_URL}/companies/{ticker}/financials",
        params={"period": "annual", "fields": "all", "limit": 1},
        timeout=20,
    )
    response.raise_for_status()
    payload = response.json()
    if not payload.get("success") or not payload.get("data"):
        raise ValueError(f"No annual financial data returned for {ticker}")
    latest = payload["data"][0]

    revenue = latest.get("revenue")
    operating_income = latest.get("operating_income")
    free_cash_flow = latest.get("free_cash_flow")
    total_debt = latest.get("total_debt")
    total_assets = latest.get("total_assets")

    return {
        "ticker": payload["company"]["ticker"],
        "period_end": latest["period_end"],
        "revenue": revenue,
        "operating_margin": ratio(operating_income, revenue),
        "fcf_margin": ratio(free_cash_flow, revenue),
        "debt_to_assets": ratio(total_debt, total_assets),
    }

df = pd.DataFrame([get_latest_fy(t) for t in ["AAPL", "MSFT", "GOOG"]])
print(df)
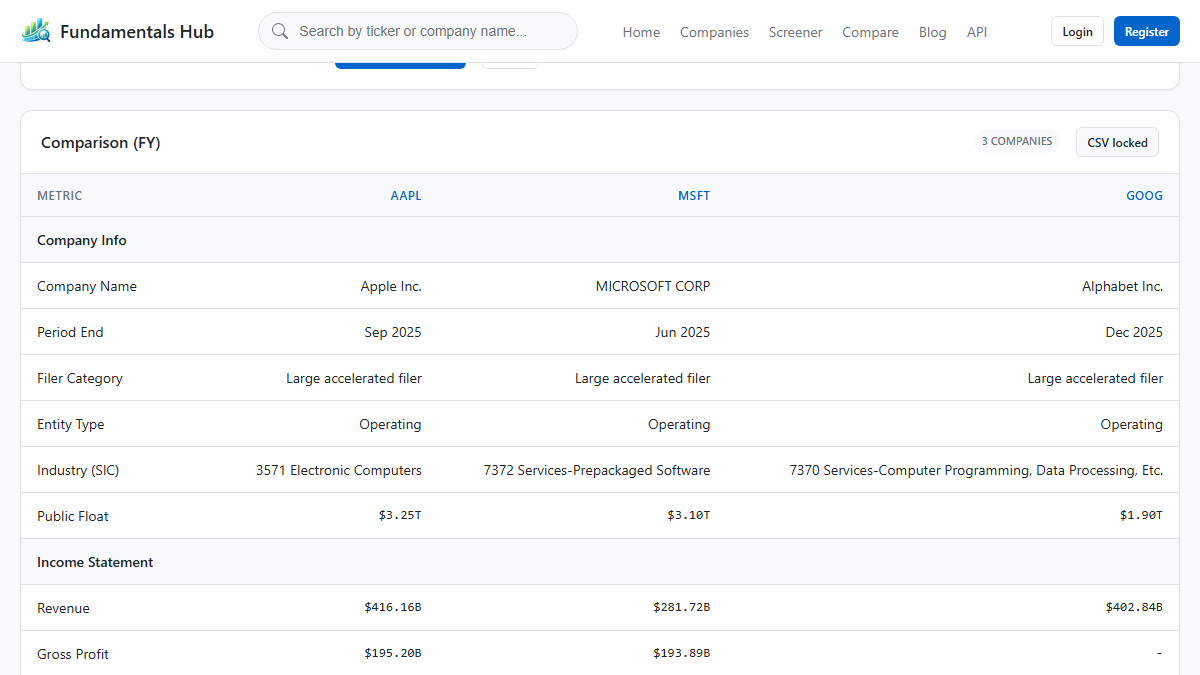
Here is the same idea with rounded latest-FY rows from the Fundamentals Hub standardized FY dataset. The period basis is consistent, but the period ends are different because fiscal calendars differ:
| Ticker | Period end | Revenue | Operating margin | FCF margin | Debt / assets |
|---|---|---|---|---|---|
| AAPL | Sep 2025 | $416.16B | 32.0% | 23.7% | 25.2% |
| MSFT | Jun 2025 | $281.72B | 45.6% | 25.4% | 7.0% |
| GOOG | Dec 2025 | $402.84B | 32.0% | 18.2% | 8.2% |
Fundamentals Hub uses GOOG as the primary Alphabet ticker in this compare view; GOOGL is Alphabet's Class A share ticker.
Keep raw values raw until the display layer. Format percentages and billions only in the final table, chart, or report.
Read the Differences, Not Just the Rankings
The goal is not to crown a winner. The goal is to explain differences. A company with lower margins might be investing aggressively. A company with higher free cash flow margin might be harvesting a mature business. A company with more debt might be stable enough to carry it, or it might have less room for error.
When a number stands out, write a short explanation next to it:
- Higher operating margin because the business has more software revenue.
- Lower free cash flow conversion because capex rose during a buildout.
- Higher debt to assets because the company uses more financial leverage.
- Lower asset turnover because the business owns more capital-intensive infrastructure.
That note-taking habit prevents the comparison from becoming a scoreboard. It also makes the analysis easier to revisit when the next filing arrives.
FAQ
What is the best way to compare company financials?
Start with a peer set, align the period basis, compare the same fields, then use ratios to explain differences. Do not begin with valuation multiples until the operating and balance sheet comparison is clear.
Should I compare annual or TTM financials?
Use TTM for a current operating snapshot and annual data for long-term trends. Do not mix annual and TTM columns in the same ranking table unless the difference is the point of the analysis.
Which metrics belong in a side-by-side financial comparison?
A compact table should include revenue, operating margin, free cash flow margin, debt to assets, and one efficiency metric such as asset turnover. Add industry-specific metrics only when they answer the question.
Why do two APIs show different company financials?
Differences can come from period selection, XBRL tag mapping, restatements, units, or how quarterly cash flow is converted. For SEC data, field normalization and provenance matter.
Can I compare companies from different industries?
You can, but the output is less useful. Cross-industry comparisons need more explanation because margins, leverage, working capital, and asset intensity vary by business model.