 Fundamentals Hub
A company reports record revenue. The stock drops 8% the next morning. To anyone watching the headline number, this makes no sense. To anyone who read the full filing, it was obvious: gross margin had compressed, inventory had climbed, and cash flow from operations had fallen even as revenue grew.
Revenue is one number. A financial statement is a complete picture. This guide walks through how to read financial statements, all three of them, using Apple's fiscal year 2025 results as the working example. Apple's FY2025 10-K was filed with the SEC on October 31, 2025, covering the fiscal year ending September 27, 2025. These are real numbers, not hypotheticals.
You do not need an accounting background. You need to understand what each statement is measuring and what questions to ask.
What the Three Financial Statements Are For
- Income Statement
- Reports revenue, expenses, and profit over a period (quarter or year). Shows whether the business made money.
- Balance Sheet
- A snapshot of what the company owns (assets), owes (liabilities), and what remains for shareholders (equity) at a single date.
- Cash Flow Statement
- Tracks actual cash movement across three categories: operations, investing, and financing. Harder to manipulate than net income.
- Free Cash Flow
- Operating cash flow minus capital expenditures. Represents spendable cash after maintaining the business.
Every US public company files three financial statements with the SEC at least once per year, inside a form called the 10-K. They measure different things and answer different questions.
The income statement answers: did the business make money? It covers a period of time, a fiscal year or quarter, and shows revenue, what it cost to generate that revenue, and what remains after all expenses.
The balance sheet answers: what does the company own and owe, right now? It is a snapshot at a single date. Total assets on one side, total liabilities plus equity on the other. By definition, those two sides are always equal.
The cash flow statement answers: where did cash actually go? Net income is an accounting figure. The cash flow statement shows real cash movement, generated by operations, spent on investments, raised or repaid through financing.
The three statements connect. Net income flows from the income statement into retained earnings on the balance sheet. The ending cash balance on the balance sheet matches cash reported in the cash flow statement. If these don't reconcile, something is wrong.
Reading one statement in isolation is rarely enough. The story is in the connections between them.
The Income Statement: Revenue Down to Net Income
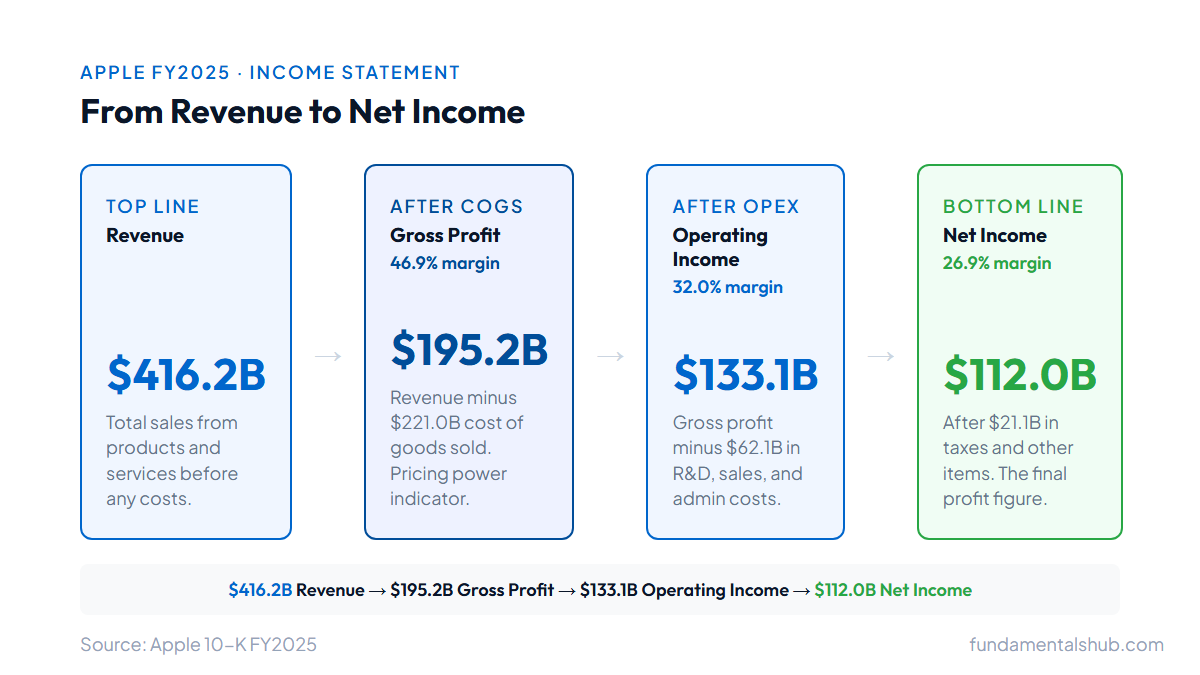
The income statement works as a series of subtractions. Start with revenue. Subtract what it cost to deliver that revenue. Subtract operating expenses. Subtract taxes and other items. What remains is net income.
Apple FY2025:
| Line | Amount |
|---|---|
| Revenue | $416.2B |
| Cost of Revenue | $221.0B |
| Gross Profit | $195.2B |
| Operating Expenses | $62.1B |
| Operating Income | $133.1B |
| Taxes & Other Items | $21.1B |
| Net Income | $112.0B |
A few lines matter more than the others.
Gross profit and gross margin show how efficiently the company converts revenue into profit before overhead. Apple's $195.2B gross profit on $416.2B in revenue is a 46.9% gross margin, for every dollar of revenue, 47 cents survive after paying for the product itself. Gross margin is the single most useful first indicator of pricing power and cost structure. A company with 60% gross margins has very different economics than one with 20%.
Operating income removes overhead: R&D, sales, marketing, and administrative costs. Apple spent $62.1B on those in FY2025, leaving $133.1B in operating income, a 32% operating margin. This is the number most analysts use when comparing how well-run companies are, because it reflects the core business before debt costs and tax strategies.
Net income is the bottom line after everything. Apple's $112.0B is the figure quoted in most headlines. It matters, but it is also the most malleable figure on the income statement. It includes non-cash charges and accounting estimates (depreciation schedules, asset write-downs, tax provisions) that management has some discretion over. Treat it as a starting point.
Revenue and net income can move in opposite directions. A company can grow revenue while cutting margins and end up with lower net income. Or it can shrink revenue dramatically while cutting costs faster, and end up more profitable. Top-line growth and profitability are separate questions.
The Balance Sheet: What the Company Owns and Owes
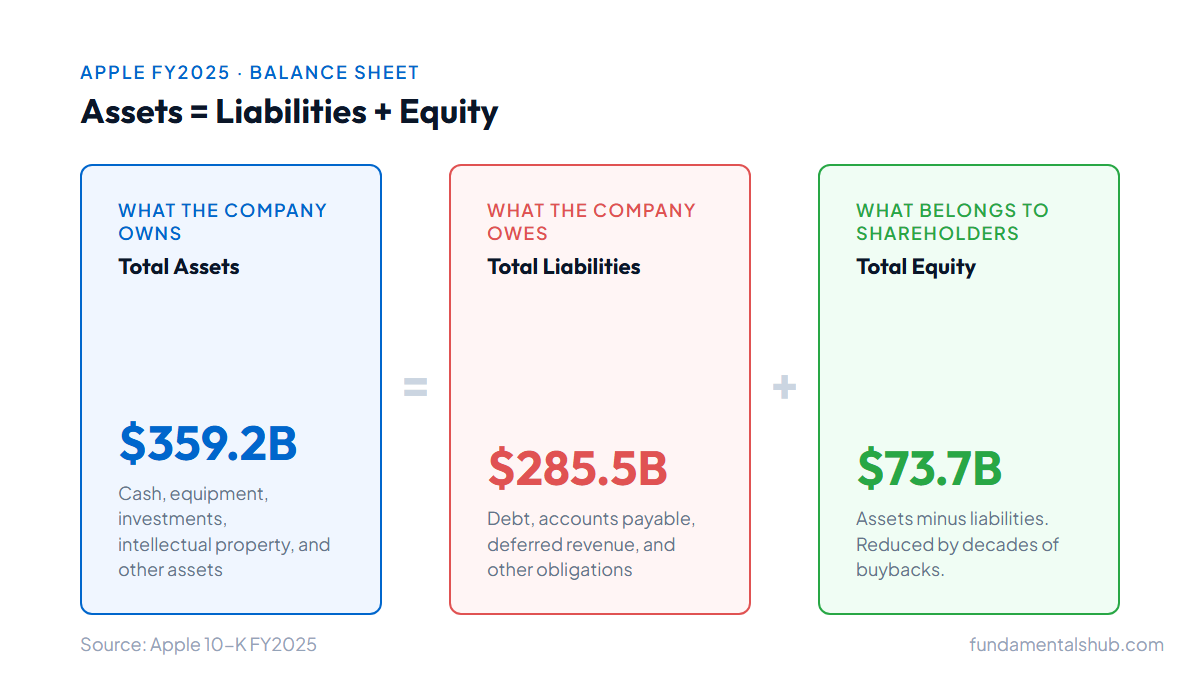
The balance sheet equation: Assets = Liabilities + Equity
Assets are what the company owns or controls. Liabilities are what it owes. Equity is the residual, what belongs to shareholders after all liabilities are settled.
Apple at September 27, 2025:
| Amount | |
|---|---|
| Total Assets | $359.2B |
| Total Liabilities | $285.5B |
| Total Equity | $73.7B |
The first thing most people notice: $285.5B in liabilities against only $73.7B in equity. Apple has roughly 3.9x more liabilities than equity. For a company generating $111.5B in operating cash flow, this is sustainable. The same ratio at a company with thin margins would be alarming. This is why the balance sheet cannot be read without the cash flow statement next to it.
Cash and cash equivalents ($35.9B) tells you how much liquidity the company has immediately. A large cash balance is a buffer against downturns. Apple's $35.9B sounds enormous, and it is, but set against $285.5B in liabilities, it is not as comfortable as the raw number suggests.
Long-term debt ($78.3B) represents bonds and notes maturing in more than a year. Apple has deliberately taken on long-term debt to fund share buybacks, a trade that reduces equity while returning capital to shareholders. Companies with strong cash generation can operate with high leverage intentionally. For a less profitable company, the same structure is a warning.
Equity is the accounting residual: total assets minus total liabilities. It is not the same as market capitalization. Apple's FY2025 book equity was $73.7B. Market capitalization changes with the share price, so it must be compared using a clearly dated market value rather than a timeless estimate. The two measures answer different questions: book equity reflects accounting net assets, while market value reflects investor expectations.
Watch how equity changes from year to year. Declining equity alongside declining profits is a warning sign. Declining equity at a profitable company that aggressively buys back stock is a different situation entirely.
The Cash Flow Statement: The Hardest One to Fake
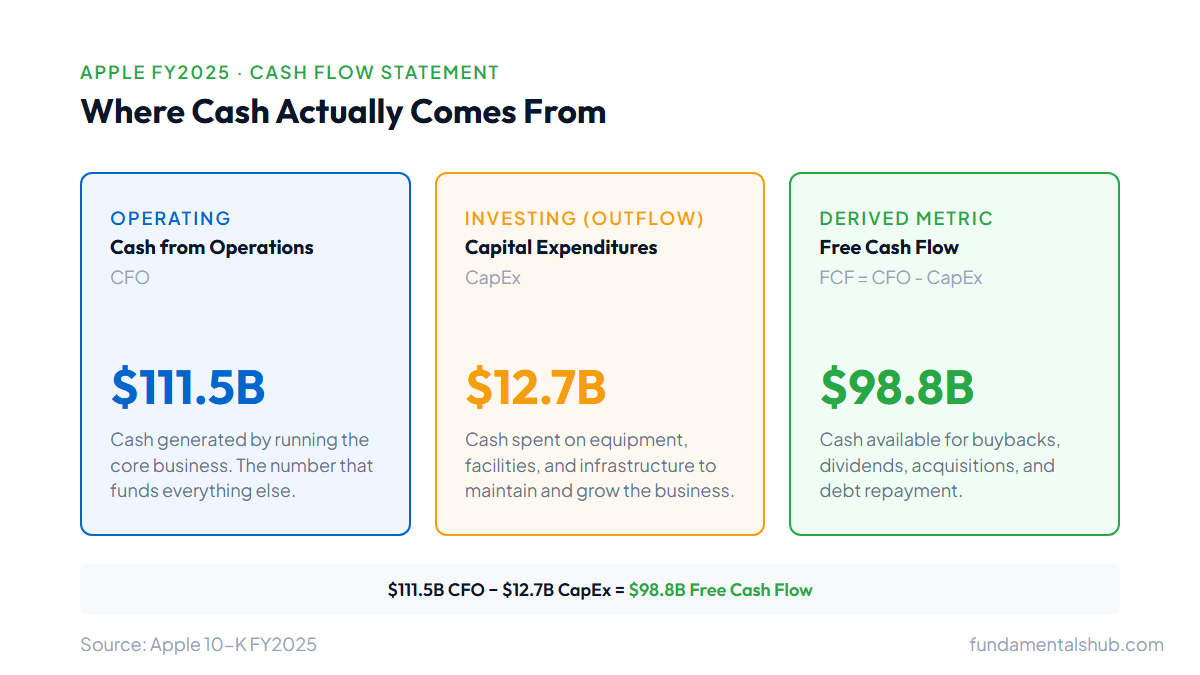
Net income is an accounting figure. The cash flow statement measures actual cash movement, which is harder to manipulate through estimates.
The statement divides into three sections:
Operating cash flow (CFO) is cash generated by running the business. Apple generated $111.5B in operating cash flow in FY2025. This is what funds everything else. CFO is close to but not the same as net income ($112.0B). The gap is explained by non-cash charges (depreciation, stock-based compensation) and changes in working capital. When CFO diverges significantly from net income, one growing while the other falls, that divergence is worth investigating.
Investing cash flow (CFI) is cash spent on or received from investments, primarily capital expenditures (equipment, buildings, infrastructure) and acquisitions. Apple spent $12.7B on CapEx in FY2025. CFI is negative for most growing companies because they are spending on assets.
Financing cash flow (CFF) covers debt and equity transactions: borrowing, repaying debt, paying dividends, and share repurchases. Apple has returned hundreds of billions to shareholders through buybacks over the past decade; those outflows appear here.
Free cash flow is not a formal line on the statement, it is derived: CFO minus CapEx. Apple's free cash flow in FY2025 was approximately $98.8B ($111.5B minus $12.7B). This is the cash available after maintaining and growing the business. For many investors, free cash flow is more important than net income because it reflects actual cash the company can deploy, for dividends, acquisitions, debt repayment, or additional buybacks.
One detail that catches first-time readers: quarterly 10-Q filings report year-to-date cash flows, not just the single quarter. The Q3 filing's cash flow statement shows nine months of activity, not three. To isolate one quarter, you subtract the prior quarter's YTD figure from the current one. There is no Q4 10-Q; fourth-quarter flows come from the 10-K annual total minus Q1, Q2, and Q3.
Reading the Three Statements Together
The statements form a closed loop, and the patterns across them tell a more complete story than any one figure.
A few cross-statement patterns worth watching:
- Net income growing, CFO falling. The business reports profits but isn't collecting cash. Accounts receivable climbing faster than revenue, sales recorded before cash arrives, is a common culprit. It can be legitimate during rapid growth. It can also flag aggressive revenue recognition.
- High net income, low free cash flow. Profitability looks strong, but after subtracting CapEx, little cash remains. This is common in capital-intensive businesses. Not necessarily a problem, just a reminder that reported profits and spendable cash are different things.
- Shrinking equity alongside strong profits. Apple's equity is small relative to its asset base partly because buybacks drain equity directly. This is a deliberate capital return strategy at a highly profitable business. The same pattern at a company with thin or declining profits is a different story.
The underlying question is whether the money flows make sense. Revenue should eventually become cash. Profits should be supported by cash generation. The balance sheet should tell a coherent story about how the business is financed and what it owns.
If you want to take the next step, calculating valuation ratios, building a comparison across multiple companies, or running a full profitability analysis, the fundamental analysis guide picks up where this one ends, using these same statements as the input.
Where to Find Financial Statements Without Digging Through PDFs
Every US public company's financial statements are available free through SEC EDGAR at sec.gov. The original 10-K filings are the authoritative source. Reading Apple's FY2025 10-K once is worth doing. The document is well-organized, and the financial statements are clearly labeled.
For ongoing work across multiple companies, the raw SEC filings are slow to navigate. The SEC also publishes an XBRL data API at data.sec.gov, which lets you pull structured financial data programmatically. The SEC EDGAR API guide covers those endpoints in detail, but the raw data requires significant normalization before it is usable, since different companies use different XBRL tags to report the same concepts.
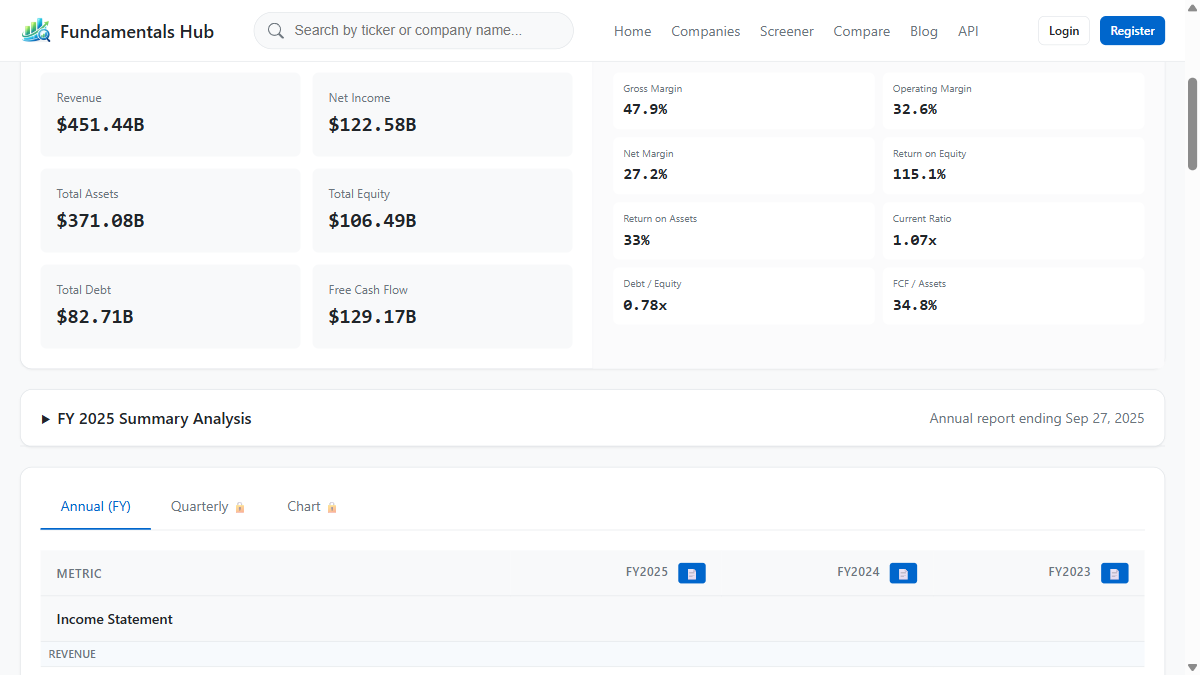
Fundamentals Hub normalizes all of that automatically. The same SEC source data, cleaned and standardized into consistent income statement, balance sheet, and cash flow fields, available via web UI or API for 8,000+ companies.
All the Apple numbers in this guide came directly from the FY2025 10-K as filed with the SEC.