 Fundamentals Hub
A ratio table can make a weak analysis look precise. Ten margins, six leverage metrics, five growth rates, and a color scale can fill a dashboard fast. The hard part in financial ratio analysis is deciding which ratios answer the question in front of you.
Financial statement analysis is the process of turning the income statement, balance sheet, and cash flow statement into a view of business quality, risk, and durability. This guide focuses on the ratios that carry the most analytical weight. It is not a beginner walkthrough of the three statements; for that foundation, start with how to read financial statements. It is also not a valuation guide. A company can be excellent and still too expensive.
Financial Statement Analysis Starts With a Question
- financial statement analysis
- Financial statement analysis uses income statement, balance sheet, and cash flow data to evaluate profitability, risk, cash generation, growth, and efficiency.
- financial ratio analysis
- Financial ratio analysis converts statement fields into comparable metrics such as margins, leverage, returns, and cash conversion.
- Liquidity ratios
- Liquidity ratios test whether a company can cover near-term obligations with near-term assets.
- Leverage ratios
- Leverage ratios measure how much debt or liability pressure supports the business.
Ratios should not come first. The question comes first.
A lender asks whether the company can meet obligations. An investor asks whether profits are durable and cash-backed. An operator asks whether margins are improving for structural reasons. A developer building a screener asks which fields can be calculated consistently across a broad universe.
Write the question in plain language before adding formulas:
| Question | Ratio family |
|---|---|
| How profitable is the business? | Margins and returns |
| Can it cover near-term obligations? | Liquidity |
| How much financial risk is present? | Leverage and solvency |
| Does profit become cash? | Cash flow quality |
| Is growth efficient? | Growth and asset use |
This framing keeps the analysis from becoming a list of numbers. It also prevents a common mistake: using the same ratio pack for every company, regardless of industry, maturity, or capital structure.
Profitability Ratios: How Much Revenue Survives
Profitability analysis starts with margins. Margins show how much revenue remains after different layers of cost.
Core formulas:
gross_margin = gross_profit / revenue
operating_margin = operating_income / revenue
pretax_margin = pretax_income / revenue
net_margin = net_income / revenue
Gross margin is closest to product economics. Operating margin includes operating expenses and gets closer to the core business model. Pretax and net margins include financing, taxes, and other items, so they are useful but need context.
Do not treat the highest margin as automatically best. A low gross margin retailer can be excellent if inventory turns quickly and working capital is controlled. A high margin software company can still disappoint if growth requires heavy sales expense or retention weakens.
For deeper operating-profit work, EBITDA can be useful in acquisition and capital structure analysis, but it is not a cash flow substitute. The EBITDA explainer covers where that metric helps and where it misleads.
Return Ratios: Profit Relative to Capital
Margins explain profit per dollar of revenue. Return ratios ask how much profit is produced per dollar of capital.
Common return ratios:
return_on_assets = net_income / average_total_assets
return_on_equity = net_income / average_total_equity
operating_return_on_assets = operating_income / average_total_assets
Return on assets is helpful when comparing companies with different asset bases. Return on equity can be distorted by leverage because debt reduces equity. A company can raise ROE by borrowing more, even when the operating business has not improved.
If you only have one balance sheet date available, period-end assets or equity can work as a quick approximation. Label it that way. For standard analysis, average the beginning and ending balance sheet values so the denominator lines up better with the income earned during the period.
A quick example: if net income is $10 billion, beginning assets are $90 billion, and ending assets are $110 billion, return on assets is 10% using the $100 billion average asset base. Using only ending assets would show 9.1%. The business did not change, but the denominator choice did.
That is why return ratios belong next to leverage ratios. A high ROE with a conservative balance sheet says something different from a high ROE supported by heavy debt.
Liquidity Ratios: Near-Term Resilience
Liquidity ratios test whether the company can handle short-term obligations. They are built from balance sheet fields, so they are point-in-time measures.
Common formulas:
current_ratio = current_assets / current_liabilities
cash_ratio = cash_and_equivalents / current_liabilities
working_capital = current_assets - current_liabilities
Liquidity analysis is industry-sensitive. A subscription software company with negative working capital can still be healthy if customers pay upfront. A manufacturer with the same headline ratio might face inventory, receivables, or supplier pressure.
The current ratio is a starting point, not a verdict. Look at the mix of current assets. Cash is different from inventory. Receivables are different from cash. A company can pass the current-ratio test and still have poor liquidity if the assets are hard to convert.
A useful practitioner check is to pair liquidity with the cash conversion cycle. If current assets are high because inventory and receivables are building faster than revenue, the current ratio can look comfortable while operating cash flow is already warning you.
Leverage Ratios: Balance Sheet Risk
Leverage ratios show how much debt and liability pressure sits behind the operating business. The relevant fields come from the balance sheet and include short-term debt, long-term debt, total liabilities, total assets, and total equity.
Useful formulas:
total_debt = short_term_debt + long_term_debt
debt_to_assets = total_debt / total_assets
debt_to_equity = total_debt / total_equity
liabilities_to_assets = total_liabilities / total_assets
Debt is not automatically bad. Stable cash flow can support more leverage than volatile cash flow. The risk appears when debt maturity, interest burden, or operating cyclicality gives management less room for error.
Be careful with equity-based ratios when equity is small, negative, or distorted by buybacks. In those cases, debt to assets or liabilities to assets can be more interpretable.
Cash Flow Quality: Does Profit Convert?
Cash flow quality asks whether reported earnings become cash. This is where financial statement analysis gets more useful than a margin table.
Start with:
free_cash_flow = cfo - abs(capex)
fcf_margin = free_cash_flow / revenue
fcf_conversion = free_cash_flow / net_income
Using abs(capex) makes the formula work whether the source stores capital expenditures as a positive cash spend or a negative cash flow. Keep that convention consistent before comparing free cash flow margins across companies.
Cash from operations can diverge from net income because of working capital, non-cash expenses, deferred revenue, or accruals. Capex then shows how much cash must be reinvested to sustain or grow the asset base. Free cash flow is not perfect, but it is hard to ignore.
If net income rises and operating cash flow does not follow, slow down. The issue may be temporary working capital. It may also be revenue quality, inventory buildup, receivables, or aggressive accounting. The ratio does not diagnose the cause by itself. It tells you where to look.
Free cash flow gets its own deeper treatment in Free Cash Flow Explained. Here, use it as a cross-check: strong accounting profit should eventually show up in cash generation.
(Fundamentals Hub standardizes CFO, capex, and free cash flow alongside income statement fields, so cash conversion can be calculated without parsing raw XBRL tags.)
Growth and Efficiency: Is Expansion Productive?
Growth is only useful when paired with efficiency and profitability. Revenue growth that requires worse margins, higher working capital, and rising debt is different from growth that expands cash flow.
Common growth and efficiency metrics:
revenue_growth = (revenue_current - revenue_prior) / revenue_prior
operating_income_growth = (operating_income_current - operating_income_prior) / operating_income_prior
asset_turnover = revenue / average_total_assets
free_cash_flow_growth = (fcf_current - fcf_prior) / fcf_prior
Asset turnover is a useful bridge between the income statement and balance sheet. It shows how much revenue the company produces from its asset base. Low turnover can be normal in capital-intensive industries. High turnover can be normal in asset-light businesses.
The interpretation depends on the business model. A company with modest growth and high cash conversion can be stronger than a company with faster growth and deteriorating economics. Be careful with ratios that use small, negative, or volatile denominators. Negative equity, near-zero net income, or a one-time asset change can make a calculated ratio mathematically correct but analytically useless.
A Worked Ratio Readout With Apple FY2025
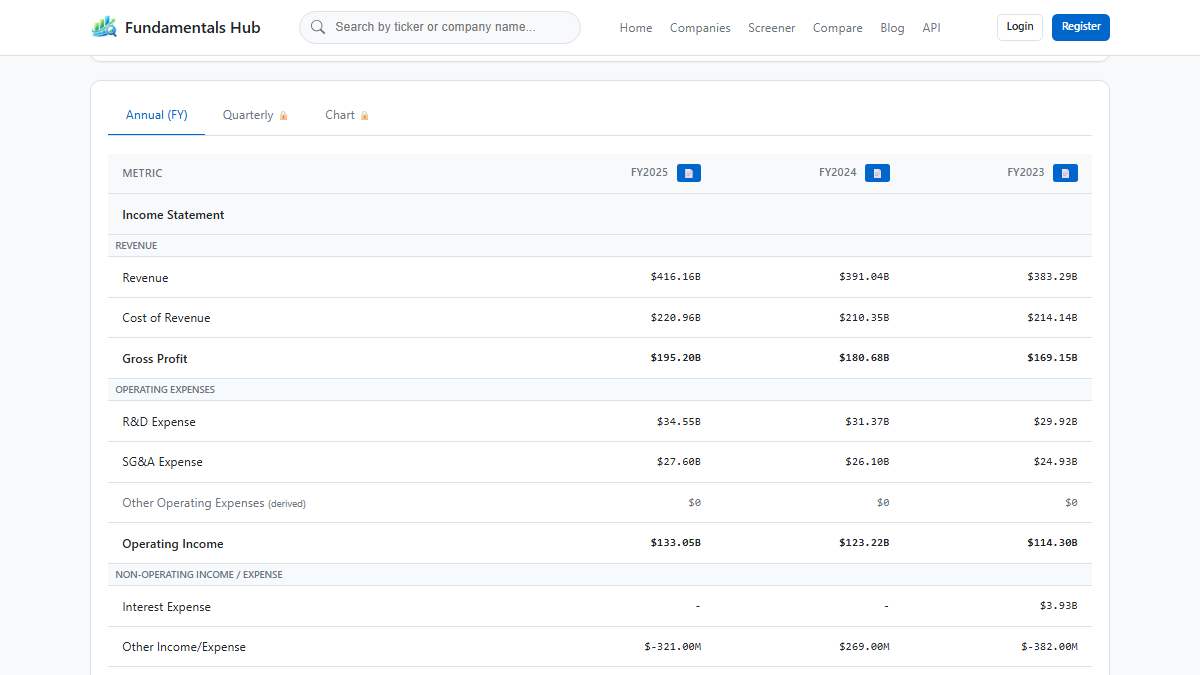
A worked readout makes the ratio stack less abstract. Using Apple FY2025 from the Fundamentals Hub standardized FY dataset:
These are standardized fiscal-year statement values, not live market data.
| Ratio | Calculation | Readout |
|---|---|---|
| Revenue growth | ($416.16B - $391.04B) / $391.04B | 6.4% growth, so scale is still expanding |
| Gross margin | $195.20B / $416.16B | 46.9%, a high gross-profit base before operating costs |
| Operating margin | $133.05B / $416.16B | 32.0%, showing strong operating discipline |
| Return on assets | $112.01B / (($364.98B + $359.24B) / 2) | 30.9%, using average total assets |
| FCF conversion | $98.77B / $112.01B | 0.88x, cash conversion positive but below net income |
| Debt to assets | $90.68B / $359.24B | 25.2%, a leverage cross-check rather than a verdict |
This does not score Apple as a buy or sell. It shows high margins, high asset returns, cash conversion below net income for the year, and leverage that needs to be compared with liquidity, maturity schedule, and peers. The next step is trend and peer context, not a one-number conclusion.
A Short Analyst Checklist
Use this order when reviewing a company:
- Confirm the period basis: FY, quarterly, or TTM.
- Read revenue growth and gross margin together.
- Compare operating margin against peers.
- Check whether net income is supported by CFO and free cash flow.
- Review liquidity before leverage.
- Compare debt to assets and liabilities to assets.
- Check whether growth improves or weakens returns.
If a ratio looks strange, trace it to the underlying fields. A bad denominator can make a ratio useless. A null field can mean missing data, not zero. A restatement can change prior periods. Raw SEC data adds another layer because different companies can use different XBRL tags for the same economic idea.
That last point matters for developers. The tag map is not a minor implementation detail. Revenue can appear under several us-gaap tags. Cash flow facts can require period logic. CIKs need zero-padding in SEC endpoints. If the analysis will run across thousands of companies, standardization is part of the analytical method.
Also separate calculation fields from interpretation fields. A ratio output should show its inputs, period end, and period type next to the computed result. When a dashboard hides the denominator, users can mistake a null value, stale filing period, or tiny denominator for a real signal.
FAQ
How is financial ratio analysis different from reading the statements?
Reading the statements tells you what happened in each report. Financial ratio analysis connects those statements so you can compare profitability, risk, cash generation, growth, and efficiency across companies or periods.
Which ratios matter most in financial statement analysis?
Operating margin, free cash flow margin, current ratio, debt to assets, liabilities to assets, return on assets, and revenue growth are a strong starting set. Add industry-specific metrics only when they answer the question.
Why should cash flow be part of ratio analysis?
Cash flow tests whether accounting profit becomes usable cash. Net income can rise while cash generation weakens, so CFO and free cash flow are essential cross-checks.
Can one ratio identify a good company?
No. A ratio can flag a question, but business quality depends on how profitability, capital needs, leverage, cash conversion, and growth fit together.
How do missing fields affect financial statement analysis?
Missing fields should be treated as unavailable, not as zero. In SEC data, a missing field can come from reporting choices, tag mapping, period selection, or a company that does not report a concept cleanly.
Which ratios mix flow and balance sheet data?
Return on assets, return on equity, and asset turnover combine income statement period data with balance sheet data. Use average assets or equity when available, or clearly label period-end approximations. Debt to assets and liabilities to assets are balance-sheet-only ratios, so they should be read as point-in-time solvency measures.